
Reviewing the Quality of Environmental Impact Assessment Reports
The following Matrix suggests a way of assessing the quality of EIA Reports in the Indian perspective. It is likely to help the regulators, the consultants the developers and other decision makers.
Structural components of the EIA report have been tabulated based on the structure of the EIA report as suggested in the EIA notification of 2006 and assigned marks based on their importance values. Each structural component is divided into a number of performance indicators and assessed on a percentage grade point basis from A to E and the percentage grade multiplied with the maximum marks and then divided by 100 to arrive at the total marks for each structural element. The Total could be used to arrive at the overall grade for the EIA.
Suggested Review of EIA
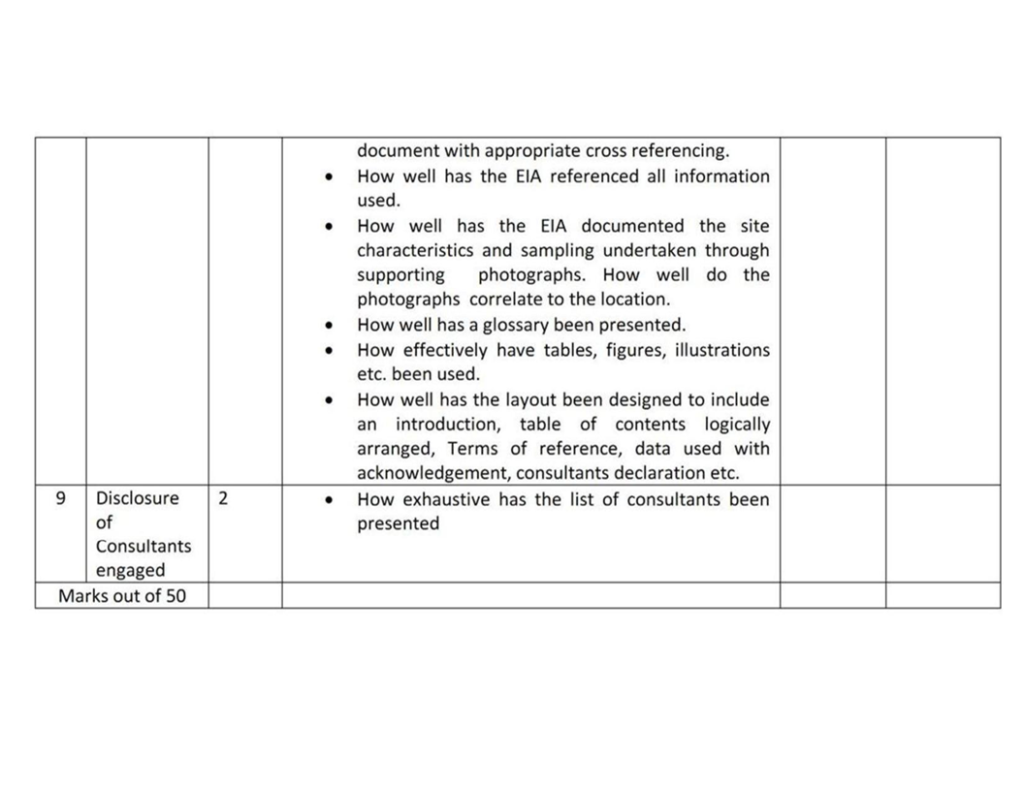
| Grade Percentage A(90%-100%) Excellent provision of information . B(76%-89%) Good provision of information with only very minor, unimportant weaknesses C(51%-75%) Adequate provision of information. Gaps or weaknesses in information not vital to the decision process D(41%-50%) Weak provision of information with gaps and weaknesses may hinder the decision process but may require minor corrections. E(Less than 40%) Very Poor provision of information with major gaps or weaknesses which would prevent the decision process proceeding and require major work to complete |